
Using Google Sheets to Organize and Manage Your Humanities Data
The goal of this 7-part workshop is to help familiarize Google Sheets users more experienced in qualitative research methods with the features most commonly used when working with Humanities-oriented data.
Before diving into the step-by-step tutorial on how to use Google Sheets as a Humanities practitioner, here’s a little back story:
In the early stages of my research, I was faced with a dilemma. I had a good idea of what my research goals were—to learn more about how an exhibition’s layout can affect aesthetic perceptions—but had no clear sense of the process necessary to turn my primary sources (exhibition catalogues) into data that would yield a visual end product (map, chart, etc.).
I was repeatedly referred by my former professors and data-guru blogs to Google Sheets as the perfect software to use to enter, organize, manipulate, and visualize my data. Not being very data-savvy myself, I spent weeks clicking around on Sheets to get it to essentially do as much of my work as it could. Having eventually figured out how to make the software reduce a bulk of my manual workload, I wanted to share some of the features that I found most useful and relevant to my qualitative data.
For any other Google Sheets novice like me who works with tabular data and could really use simplified explanations of some of the most commonly-used features on this software, I’ve created a 7-part asynchronous workshop, along with short exercises for practice, that will explain how to organize, analyze, and visualize your data.
If you’d like to work on the exercises without compromising or manipulating your own data, you can use this practice dataset. Simply click on the link to open it and, under File, select Make a copy to edit it as your own document without making any changes to the shared file.
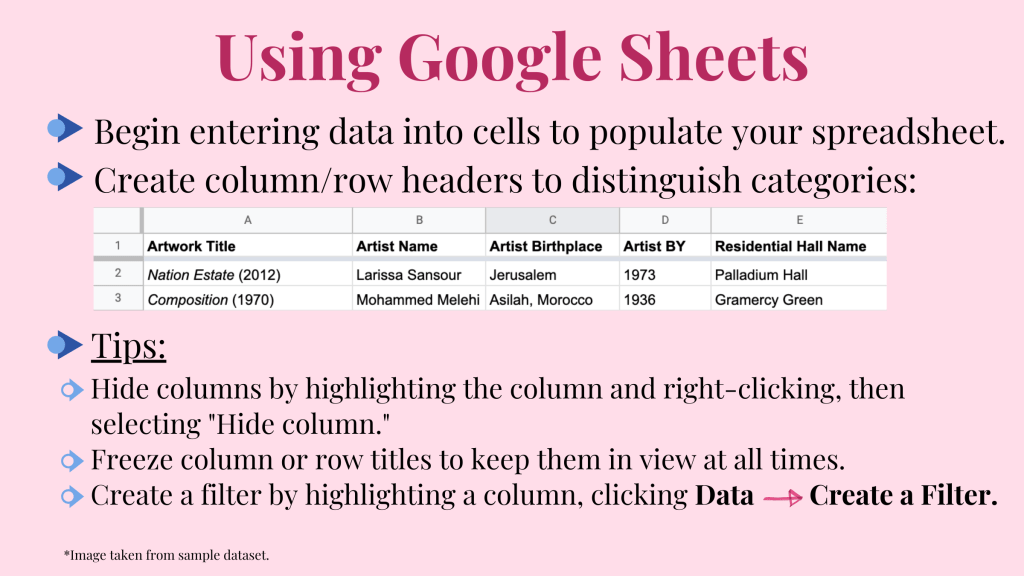
The fictional practice set contains artworks titles, artist information, and geospatial data that imagines an ambitious scenario in which NYU residential halls display artworks on their premises; this is not actually the case, but rather simply serves as a learning tool.
Here’s a helpful glossary of Google Sheets terms that you’ll come across while using this software.
Workshop Topics
- Setting up your table
- Tool 1: Code tables
- Tool 2: Data Validation
- Tool 3: Conditional Formatting
- Tool 4: VLookup (coming soon!)
- Tool 5: Column Statistics & Filters (coming soon!)
- Tool 6: Pivot Tables (coming soon!)
What you’ll need:
- Structured/tabular data or repetitive data
- Examples: authors published by a publishing house, exhibitions shown at a museum over time, villages on a historical map and their respective resources or populations, etc.
- Google Sheets or Microsoft Office access
If you’d like to download the full workshop presentation slides, you can find them here.
The Setup
In order to start working with your data in Google Sheets, whether you will be importing your data or typing it in manually, you’ll need to create a new spreadsheet by following these steps.
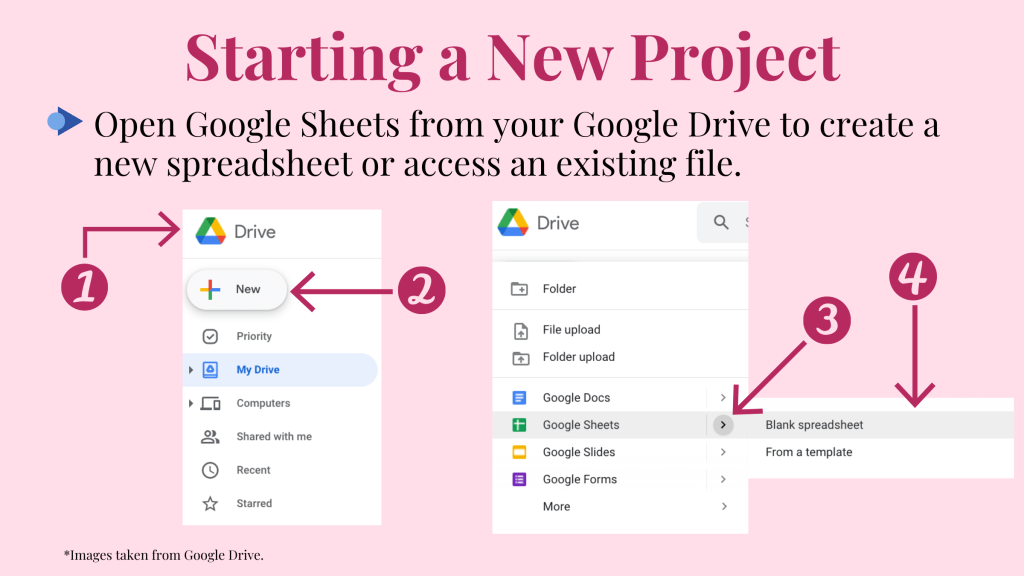
- Open your Google Drive homepage.
- Click on “New” to open the dropdown menu shown on the right.
- Hover down to “Google Sheets” and over the little arrow.
- Click on “Blank spreadsheet” to create an empty/new file or “From a template” to choose from Google’s spreadsheet templates (for budgeting, calendars, grade-tracking, to-do lists, etc.)
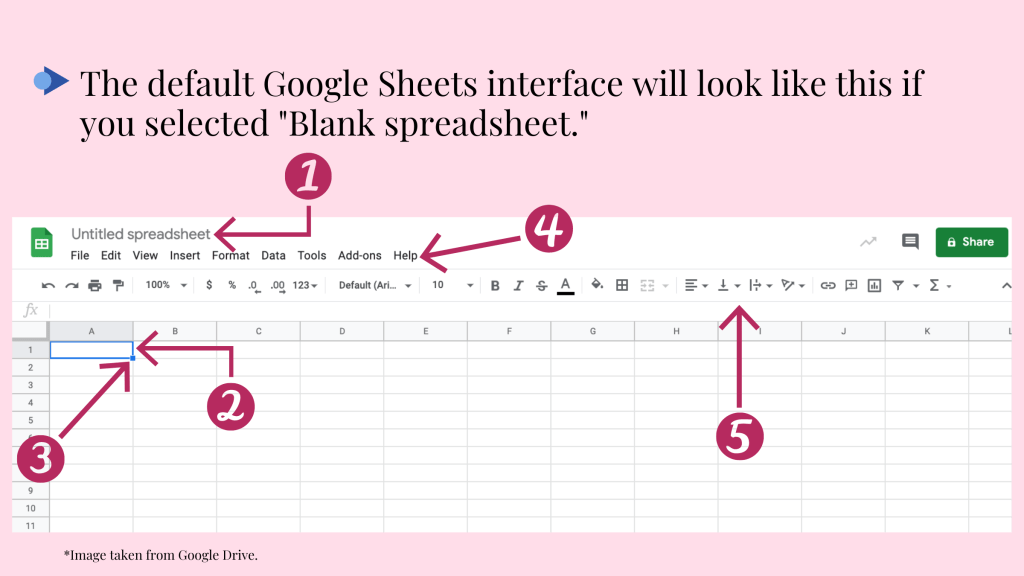
- Enter your spreadsheet/document title here.
- This is a cell. Once selected, a cell’s borders will turn blue.
- Drag the little square at the corner of each cell to copy its information or the function applied in it to the cells above, below, or beside it.
- This is the Google Sheets menu, which contains most of the features also found in the formatting toolbar (5).
- This is the formatting toolbar from where you can format fonts and cells, as well as apply functions.
Congratulations on successfully creating a spreadsheet in Google Sheets! The road ahead may seem long and challenging, but this workshop is here to help. In no time, you’ll become a whiz at auto-populating your spreadsheet, manipulating your data, and visualizing the information you’ve spent time and effort collecting. By following along with these lessons and exercises, you can build the confidence necessary to command your data and explore additional Google Sheets features on your own.
I’d love to know: what’s your dataset about? How do you hope to use Google Sheets in your project? And, as always, if you have any questions or feedback, feel free to share them in the comments below.
